Noteworthy Friday Option Activity: OXY, NOW, ENPH Friday, April 5, 1:22 PM ET, by Market News Video Staff Among the underlying components of the S&P 500 index, we saw noteworthy options trading volume ...
Monday Sector Laggards: Energy, Healthcare Monday, April 8, 3:42 PM ET, by Market News Video Staff The worst performing sector as of midday Monday is the Energy sector, not showing much ...
Notable Monday Option Activity: CMG, NVDA, KTOS Monday, April 8, 3:45 PM ET, by Market News Video Staff Among the underlying components of the Russell 3000 index, we saw noteworthy options trading volume ...
FTA, GM, CINF, OXY: ETF Inflow Alert Tuesday, April 9, 10:55 AM ET, by Market News Video Staff Symbols mentioned in this story: FTA, GM, CINF, OXY Exchange traded funds (ETFs) trade just ...
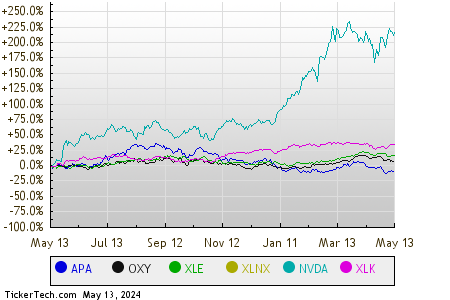
Looking at the sectors faring best as of midday Monday, shares of Energy companies are outperforming other sectors, higher by 4.2%. Within the sector, APA Corp (NASDAQ:APA) and Occidental Petroleum Corp (NYSE:OXY) are two large stocks leading the way, showing a gain of 7.7% and 6.8%, respectively. Among energy ETFs, one ETF following the sector is the Energy Select Sector SPDR ETF (NYSE:XLE), which is up 3.8% on the day, and up 28.48% year-to-date. APA Corp, meanwhile, is up 22.45% year-to-date, and Occidental Petroleum Corp is up 35.59% year-to-date. Combined, APA and OXY make up approximately 3.3% of the underlying holdings of XLE.
The next best performing sector is the Technology & Communications sector, up 1.4%. Among large Technology & Communications stocks, Xilinx, Inc. (XLNX) and NVIDIA Corp (NASDAQ:NVDA) are the most notable, showing a gain of 5.9% and 4.9%, respectively. One ETF closely tracking Technology & Communications stocks is the Technology Select Sector SPDR ETF (XLK), which is up 1.3% in midday trading, and up 21.80% on a year-to-date basis. Xilinx, Inc., meanwhile, is up 7.72% year-to-date, and NVIDIA Corp is up 67.26% year-to-date. Combined, XLNX and NVDA make up approximately 5.4% of the underlying holdings of XLK.
Comparing these stocks and ETFs on a trailing twelve month basis, below is a relative stock price performance chart, with each of the symbols shown in a different color as labeled in the legend at the bottom:
Here's a snapshot of how the S&P 500 components within the various sectors are faring in afternoon trading on Monday. As you can see, eight sectors are up on the day, while one sector is down.
Sector
% Change
Energy
+4.2%
Technology & Communications
+1.4%
Industrial
+1.2%
Materials
+1.2%
Services
+1.0%
Financial
+0.8%
Consumer Products
+0.6%
Healthcare
+0.4%
Utilities
-1.2%
This Article's Word Cloud:AmongChangeCombinedCommunicationsComparingConsumerCorpDividendETFsEnergyFinancialGiantsHealthcareHeldHereIndustrialLookingMaterialsMondayNVDANYSEOccidentalPetroleumProductsSPDRSectorSelectTechnologyXLNXXilinxapproximatelybasisbestdatefaringgainholdingslargemakemeanwhilemiddayrespectivelysectorsectorsshowingstockstradingunderlyingwhichyear
Any ideas and opinions presented in all Market News Video clips are for informational and educational purposes
only, and do not reflect the opinions of BNK Invest, Inc. or any of its affiliates, subsidiaries or partners.
In no way should any content contained herein be interpreted to represent trading or investment advice.
None of the information contained herein constitutes a recommendation that any particular security, portfolio,
transaction, or investment strategy is suitable for any specific person. All viewers agree that under no
circumstances will BNK Invest, Inc,. its subsidiaries, partners, officers, employees, affiliates, or agents be held
liable for any loss or damage caused by your reliance on information obtained. Read Full Disclaimer.
X
Wait! Don't leave yet.
Want to receive our latest research absolutely free?
⤹
Click the button below for your complimentary copy of Your Early Retirement Portfolio: Dividends Up to 8.7%—Every Month—Forever.
You'll discover the details on 4 stocks and funds that pay you massive dividends as high as 8.7%.