ProShares Ultra S&P500 Experiences Big Outflow Wednesday, April 17, 10:46 AM ET, by Market News Video Staff Symbols mentioned in this story: SSO, DHR, PFE, ETN Exchange traded funds (ETFs) trade just ...
Relative Strength Alert For Advanced Micro Devices Wednesday, April 17, 4:35 PM ET, by Market News Video Staff Legendary investor Warren Buffett advises to be fearful when others are greedy, and be greedy ...
See Which Of The Latest 13F Filers Holds Pfizer Thursday, April 18, 9:32 AM ET, by Market News Video Staff At Holdings Channel, we have reviewed the latest batch of the 21 most recent 13F ...
December 20th Options Now Available For Pfizer (PFE) Thursday, April 18, 10:38 AM ET, by Market News Video Staff Investors in Pfizer Inc (PFE) saw new options become available today, for the December 20th ...
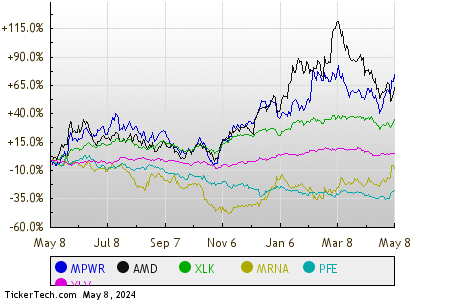
The worst performing sector as of midday Monday is the Technology & Communications sector, higher by 0.6%. Within the sector, Monolithic Power Systems Inc (NASDAQ:MPWR) and Advanced Micro Devices Inc (NASDAQ:AMD) are two large stocks that are lagging, showing a loss of 7.6% and 2.8%, respectively. Among technology ETFs, one ETF following the sector is the Technology Select Sector SPDR ETF (NYSE:XLK), which is up 1.1% on the day, and up 29.08% year-to-date. Monolithic Power Systems Inc, meanwhile, is up 37.94% year-to-date, and Advanced Micro Devices Inc is up 52.61% year-to-date. Combined, MPWR and AMD make up approximately 1.2% of the underlying holdings of XLK.
The next worst performing sector is the Healthcare sector, higher by 1.2%. Among large Healthcare stocks, Moderna Inc (NASDAQ:MRNA) and Pfizer Inc (NYSE:PFE) are the most notable, showing a loss of 16.0% and 4.2%, respectively. One ETF closely tracking Healthcare stocks is the Health Care Select Sector SPDR ETF (XLV), which is up 0.7% in midday trading, and up 16.90% on a year-to-date basis. Moderna Inc, meanwhile, is up 146.75% year-to-date, and Pfizer Inc is up 45.48% year-to-date. Combined, MRNA and PFE make up approximately 5.3% of the underlying holdings of XLV.
Comparing these stocks and ETFs on a trailing twelve month basis, below is a relative stock price performance chart, with each of the symbols shown in a different color as labeled in the legend at the bottom:
Here's a snapshot of how the S&P 500 components within the various sectors are faring in afternoon trading on Monday. As you can see, nine sectors are up on the day, while none of the sectors are down.
Sector
% Change
Services
+3.1%
Financial
+2.6%
Energy
+2.6%
Industrial
+2.5%
Consumer Products
+2.3%
Materials
+2.2%
Utilities
+2.0%
Healthcare
+1.2%
Technology & Communications
+0.6%
This Article's Word Cloud:AdvancedAmongBuyingCareChangeCombinedCommunicationsComparingConsumerDevicesETFsEnergyFinancialHealthHealthcareMPWRMRNAMicroModernaMondayMonolithicNYSEPfizerPowerSPDRSectorSelectSystemsTechnologyapproximatelybasisdatehigherholdingslargelossmakemeanwhilemiddayperformingrespectivelysectorsectorsshowingstockstradingunderlyingwhichworstyear
Any ideas and opinions presented in all Market News Video clips are for informational and educational purposes
only, and do not reflect the opinions of BNK Invest, Inc. or any of its affiliates, subsidiaries or partners.
In no way should any content contained herein be interpreted to represent trading or investment advice.
None of the information contained herein constitutes a recommendation that any particular security, portfolio,
transaction, or investment strategy is suitable for any specific person. All viewers agree that under no
circumstances will BNK Invest, Inc,. its subsidiaries, partners, officers, employees, affiliates, or agents be held
liable for any loss or damage caused by your reliance on information obtained. Read Full Disclaimer.
X
Wait! Don't leave yet.
Want to receive our latest research absolutely free?
⤹
Click the button below for your complimentary copy of Your Early Retirement Portfolio: Dividends Up to 8.7%—Every Month—Forever.
You'll discover the details on 4 stocks and funds that pay you massive dividends as high as 8.7%.