Analysts Expect 10% Upside For SPLG Monday, April 15, 6:57 AM ET, by Market News Video Staff Looking at the underlying holdings of the ETFs in our coverage universe at ETF Channel, ...
Implied PBUS Analyst Target Price: $56 Monday, April 15, 7:01 AM ET, by Market News Video Staff Looking at the underlying holdings of the ETFs in our coverage universe at ETF Channel, ...
APA November 15th Options Begin Trading Monday, April 15, 10:39 AM ET, by Market News Video Staff Investors in APA Corp (APA) saw new options become available today, for the November 15th ...
XLB, LIN, SHW, FCX: Large Inflows Detected at ETF Monday, April 15, 10:53 AM ET, by Market News Video Staff Symbols mentioned in this story: XLB, LIN, SHW, FCX Exchange traded funds (ETFs) trade just ...
APA Shares Cross 3% Yield Mark Monday, April 15, 3:16 PM ET, by Market News Video Staff In trading on Monday, shares of APA Corp (APA) were yielding above the 3% mark ...
Tuesday Sector Laggards: Energy, Materials
By Market News Video Staff, Tuesday, January 16, 2:32 PM ET
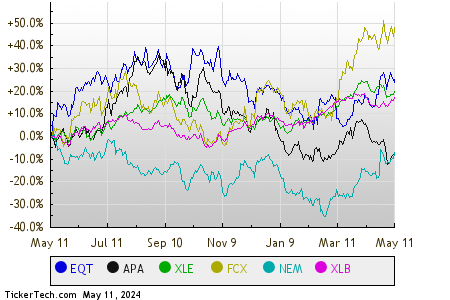
The worst performing sector as of midday Tuesday is the Energy sector, showing a 2.0% loss. Within that group, EQT Corp (NYSE:EQT) and APA Corp (NASDAQ:APA) are two of the day's laggards, showing a loss of 3.4% and 3.2%, respectively. Among energy ETFs, one ETF following the sector is the Energy Select Sector SPDR ETF (NYSE:XLE), which is down 2.1% on the day, and down 3.44% year-to-date. EQT Corp, meanwhile, is down 5.46% year-to-date, and APA Corp, is down 12.22% year-to-date. Combined, EQT and APA make up approximately 1.7% of the underlying holdings of XLE.
The next worst performing sector is the Materials sector, showing a 1.4% loss. Among large Materials stocks, Freeport-McMoran Copper & Gold (NYSE:FCX) and Newmont Corp (NYSE:NEM) are the most notable, showing a loss of 4.8% and 3.9%, respectively. One ETF closely tracking Materials stocks is the Materials Select Sector SPDR ETF (XLB), which is down 1.2% in midday trading, and down 3.66% on a year-to-date basis. Freeport-McMoran Copper & Gold, meanwhile, is down 8.12% year-to-date, and Newmont Corp, is down 12.60% year-to-date. Combined, FCX and NEM make up approximately 10.3% of the underlying holdings of XLB.
Comparing these stocks and ETFs on a trailing twelve month basis, below is a relative stock price performance chart, with each of the symbols shown in a different color as labeled in the legend at the bottom:
Here's a snapshot of how the S&P 500 components within the various sectors are faring in afternoon trading on Tuesday. As you can see, none of the sectors are up on the day, while nine sectors are down.
Sector
% Change
Services
-0.4%
Utilities
-0.5%
Technology & Communications
-0.5%
Financial
-0.7%
Healthcare
-0.8%
Consumer Products
-1.0%
Industrial
-1.0%
Materials
-1.4%
Energy
-2.0%
This Article's Word Cloud:AmongBuyingChangeCombinedCommunicationsComparingConsumerCopperCorpETFsEnergyFinancialFreeportGoldHealthcareHereIndustrialInsidersMaterialsMcMoranNYSENewmontProductsSPDRSectorSelectServicesStartStocksTuesdayapproximatelybasisdatedownholdingslossmakemeanwhilemiddayperformingrespectivelysectorsectorsshowingstockstradingunderlyingwhichworstyear
Any ideas and opinions presented in all Market News Video clips are for informational and educational purposes
only, and do not reflect the opinions of BNK Invest, Inc. or any of its affiliates, subsidiaries or partners.
In no way should any content contained herein be interpreted to represent trading or investment advice.
None of the information contained herein constitutes a recommendation that any particular security, portfolio,
transaction, or investment strategy is suitable for any specific person. All viewers agree that under no
circumstances will BNK Invest, Inc,. its subsidiaries, partners, officers, employees, affiliates, or agents be held
liable for any loss or damage caused by your reliance on information obtained. Read Full Disclaimer.
X
Wait! Don't leave yet.
Want to receive our latest research absolutely free?
⤹
Click the button below for your complimentary copy of Your Early Retirement Portfolio: Dividends Up to 8.7%—Every Month—Forever.
You'll discover the details on 4 stocks and funds that pay you massive dividends as high as 8.7%.